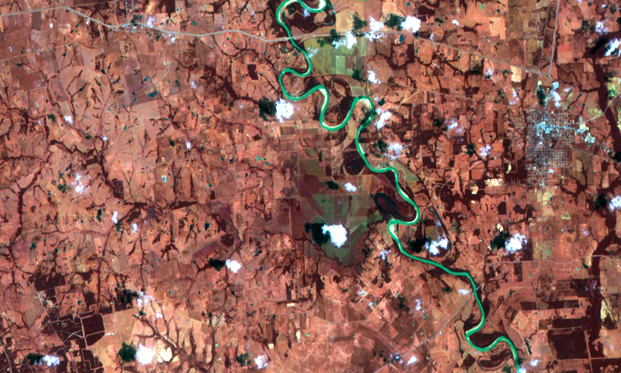
Analyzing vegetation using NDVI
Before you can start analyzing a Satellite Image on ENVI, what you need is obviously an image. There are several websites where you can download Satellite images from such as glovis.usgs.gov, terraserver.com, etc.
Start the ENVI program and wait for the application to load. A menu bar, like the one below, will come up on your screen.
Go to File/Open External File/Generic Formats/ [type of your file format]
Locate the folder containing your downloaded images and select the files that contain Band 1, Band 2, Band 3, and Band 4. Why only these four bands? We will get to that as we progress through the rest of the tutorial.
One way to measure vegetation is by the use of vegetation indices. In this tutorial, I will show you how to use Normalized Difference Vegetation Index (NDVI). NDVI is a type of vegetation indices that is used to estimate the likelihood that vegetation was actively growing at the time of data acquisition. Check out the picture on NDVI in Image gallery below to find out the NDVI equation and what it means.
To calculate NDVI, we need NIR band and red visible band. I got my images from LandSat 7. In LandSat 7 images, Band 1 contains the blue region; Band 2 contains the green region; Band 3 contains the red region; and Band 4 contains the Near Infrared Region (NIR).
After the image selection, load the image and the following window will come up showing the selected bands.
The way you recognize the Band number from the file is by the file name. If the file name ends in _B10 then it means it is Band 1, if it ends in _B20 then it is Band 2, and so on. First, let’s open a visible image which contains all red, green, and blue spectrums. To do this, Select RGB color and select the corresponding Band number with the color and click load RGB. The following windows will appear and you can see a colorful image of your location.

Now let’s try to do some calculation. We don’t want to close this nice looking colorful image so what we are going to do is open another display. Go to the menu bar and find Basic Tools/Band Math. The following screen will show up.
Type (float(B4)-float(B3))/(float(B4)+float(B3)) in the Enter an Expression field and hit ok. Next, it will prompt you to assign the variables B4 and B3. Assign the variables by selecting the right Band number and then select output to memory. Then hit ok. Another window will pop up, do the same thing and hit ok. Now, you will notice in the Available Band List window a new file with the name memory. This contains the NDVI information.
Select the memory file name, select Gray Scale, then select New Display and hit ok. Second Display will open up and you can work side by side. You can also link the displays to have the window display the same coordinate. To do this select Tools/Link/Link Display from any of the two display window.
Now we will color map the NDVI display as it is kind of difficult to work on gray scale. To do we will select Tools/Color Mapping/ ENVI Color Tables.
If you double click inside the square box in the NDVI display, a cursor/location value window will open up. The data value in this window is the NDVI. As you move your cursor over the image, you will find the NDVI values. Now let’s get some statistics precisely for graphing purposes. To do this, go to Basic Tools in the menu bar and select Statistics/Compute Statistics. Select Memory file and hit ok. If you need a histogram, you can select histogram and ENVI can show you a histogram. You can even save the data in a text file for plotting in MatLab. If you need more help, send me a brief message and I will try to help you as much as possible.


